BEGIN:VCALENDAR
VERSION:2.0
PRODID:-//entrinsik//Enrole//EN
METHOD:PUBLISH
X-MS-OLK-FORCEINSPECTOROPEN:TRUE
BEGIN:VTIMEZONE
TZID:America/New_York
BEGIN:STANDARD
DTSTART:20260308T020000
TZOFFSETFROM:-0500
TZOFFSETTO:-0400
END:STANDARD
BEGIN:DAYLIGHT
DTSTART:20261101T020000
TZOFFSETFROM:-0400
TZOFFSETTO:-0500
END:DAYLIGHT
END:VTIMEZONE
BEGIN:VEVENT
UID:20260525T123226Z-60B3F440
PRIORITY:5
CLASS:PUBLIC
TRANSP:OPAQUE
SEQUENCE:0
DTSTAMP:20260525T123226Z
DTSTART;TZID=America/New_York:20260610T173000
DTEND;TZID=America/New_York:20260610T203000
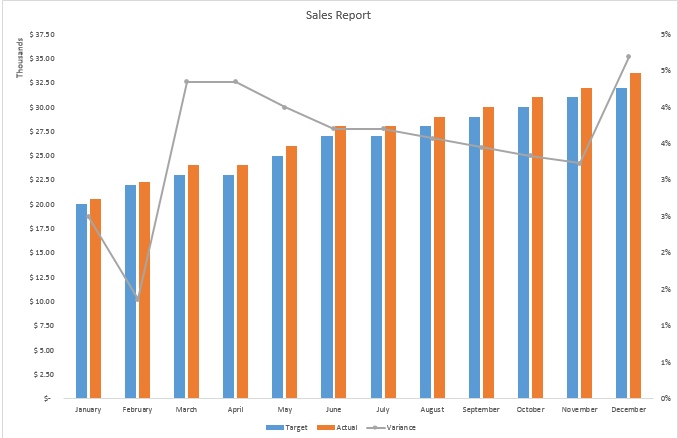
DESCRIPTION:Event Description:\n\nExcelŽ: Visualizing Data with Charts \n\n<img src="https://www.enrole.com:443/pfw/images/custom/general/cbce8b47-7f73-46f3-be30-7c98ef60e80d.png" "="" style="height: 320px; width: 450px"><font color="green"><font size="+1" style="" face="Tahoma"><b style=""><font color="#084B8A" style="">Interpret your ExcelŽ data and organize it to create visually appealing charts and graphs.</font></b></font></font><div><font size="+1" style="" face="Tahoma"><b style=""><font color="#084b8a"><br></font></b></font><p data-start="42" data-end="353"><font face="Tahoma" size="4">ExcelŽ: Visualizing Data with Charts focuses on helping you turn data into clear, useful visuals that support better understanding and decision-making. This course shows you how to use Excel's charting tools to answer questions, highlight key trends, and share insights effectively across teams and departments.</font></p><p data-start="355" data-end="651"><font face="Tahoma" size="4">You'll learn how to create and format charts that present information clearly, along with more advanced features that allow you to analyze and compare data in meaningful ways. By the end of the course, you'll be able to communicate data-driven insights with confidence using well-designed charts.</font></p><p data-start="355" data-end="651"><font face="Tahoma" size="4"><br></font></p><p data-start="355" data-end="651"><br></p><p data-start="653" data-end="683"><strong data-start="653" data-end="683"><font face="Tahoma" size="4">Course Highlights Include:</font></strong></p><p></p><ul><li><font face="Tahoma" size="4">Creating and inserting charts</font></li><li><font face="Tahoma" size="4">Modifying and formatting charts</font></li><li><font face="Tahoma" size="4">Using advanced chart features such as forecasting, trendlines, dual-axis charts, and chart templates</font></li></ul><div><font face="Tahoma" size="4"><br></font></div><p><i><font face="Tahoma" size="4">Prerequisite: Basic knowledge of ExcelŽ.</font></i></p><p><i><font face="Tahoma" size="4"><br></font></i></p><p><font face="Tahoma" size="4" style=""><b>About the Instructor</b></font></p><table cellspacing="0" cellpadding="0" style="margin: 0px; outline: none; color: rgb(0, 0, 0); font-family: Verdana; font-size: 11px; background-color: rgb(255, 255, 255);"><tbody style="margin: 0px; outline: none;"><tr style="margin: 0px; outline: none;"><td align="left" style="margin: 0px; outline: none; vertical-align: bottom;"><div class="GFHG40XLK" style="margin: 0px; outline: none; user-select: text;"><table cellspacing="0" cellpadding="0" style="margin: 0px; outline: none;"><tbody style="margin: 0px; outline: none;"><tr style="margin: 0px; outline: none;"><td align="left" style="margin: 0px; outline: none; vertical-align: top;"></td><td align="left" style="margin: 0px; outline: none; vertical-align: top;"><div class="GFHG40XHPC" aria-hidden="false" style="margin: 0px; outline: none; float: left;"><table cellspacing="0" cellpadding="0" style="margin: 0px; outline: none; float: left; display: inline; padding-right: 0px;"><tbody style="margin: 0px; outline: none;"><tr style="margin: 0px; outline: none;"><td align="left" style="margin: 0px; outline: none; vertical-align: top;"><div class="gwt-HTML" style="margin: 0px; outline: none; float: left; display: inline; padding-right: 5px;"><font face="Tahoma" size="4"><i>Todd Raines is the IT Training Coordinator at Purdue University Fort Wayne. Raines is the 2008 recipient of the University Continuing Education Association (UCEA) Mid-America Region Excellence in Teaching and Faculty Service Award.</i></font></div></td></tr></tbody></table></div></td></tr></tbody></table></div></td></tr></tbody></table></div> \n\nEvent Schedule:\n\nWednesday, June 10 (1 session)\n\nEvent Location:\n\nOnline Course\nOnline Course \nFort Wayne, IN 46805\n
LOCATION:Online Course, Online Course, Fort Wayne, IN, 46805
SUMMARY:ExcelŽ: Visualizing Data with Charts
BEGIN:VALARM
TRIGGER:-P1D
REPEAT:4
DURATION:PT6H
ACTION:DISPLAY
END:VALARM
END:VEVENT
END:VCALENDAR