
Course Detail: CMP502 - Excel®: Visualizing Data with Charts
 Interpret your Excel® data and organize it to create visually appealing charts and graphs.
Whether you need to crunch numbers for sales, information technology, human resources, or other organizational purposes and departments, the ability to get the right information to the right people at the right time can create a powerful competitive advantage. You need to be able to extract actionable organizational intelligence from your raw data. In other words, when you have questions about your data, you need to know how to get Excel® to provide the answers for you. And that's exactly what this course aims to help you do.
Course Highlights:
- Create and insert charts
- Modify and format charts
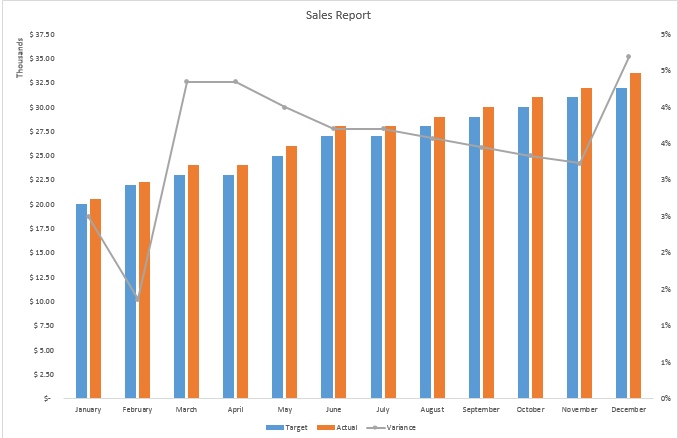
- Use advanced chart features including: forecasting, trendlines, dual-axis charts, and learn how to create and use chart templates
Prerequisite: Basic knowledge of Excel®.